
We have repeated this phrase dozens of times, but here we go again. Mathematical patterns are based on Time… not price.
Start here… and here and here for more.
Today, we will discuss dynamic systems and use tent maps to visualize the waves of a fractal. This relationship will show how the duration of a fractal determines its structure… and how fractal structures adjust to chaos.
To do this, we need to start with a few basic theories and premises.
Dynamic systems are functions that describe the time dependance of a point in ambient space. As time progresses, the location of a point changes and so does the length of depth of a wave. The amount of time that lapsed between observations determines how large or small the structure may be. Examples include clock pendulums, water flow in a bathtub and the motions of celestial bodies (the three body problem which we may get into later… maybe).
The financial markets are dynamics systems with chaos mixed in. If emotion, news, reports and events were eliminated, the financial market would follow very repeatable quasi-periodic sin waves. These waves can be mapped like any other dynamic system, with a very simple Newton method. f (x) = x/2 + 1/x
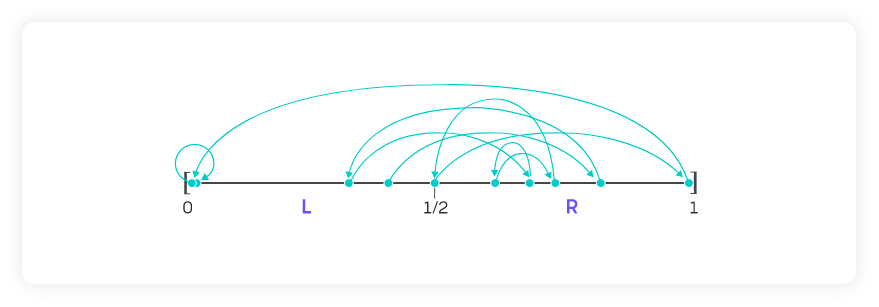
Oscillating patterns would start with very short duration patterns followed by very long duration patterns followed again by a sum and average of the two (we will discuss infinite series later) over and over again until infinitely repeating the same duration all the time. It would eventually become very boring and it would look like this:
Duration of 2, 12, 5, 10, 6, 9, 7, 8, 7… repeat.
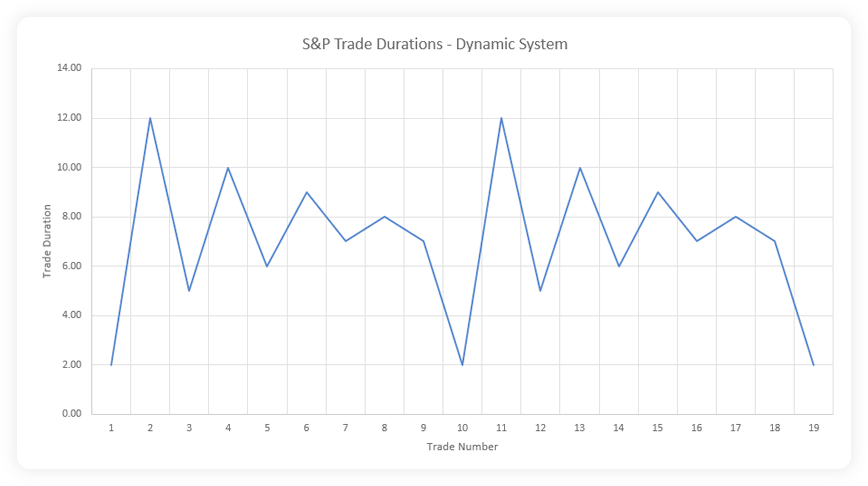
This process can be experimented with by taking a stagnant tub of water and tilting it before returning to the neutral position. Waves in the water progressively reach lower highs at a rate similar to what’s shown above. Another tilt, another neutral positions and the process repeats. Absent any chaos (fish, aggressive shaking, etc), the water always follows the same pattern.
But in the markets chaos exists. And these very programmable oscillations get disrupted enough to change the duration of each pattern just enough to undyn… uh… screw up the pattern.We demonstrated the results of this chaos in a study we conducted about March Madness and its ability to strip emotion from the markets. We wrote two articles on this subject actually.
Visually, these new patterns look a bit different while still following the underlying principles of a dynamic system.
Here is an example:
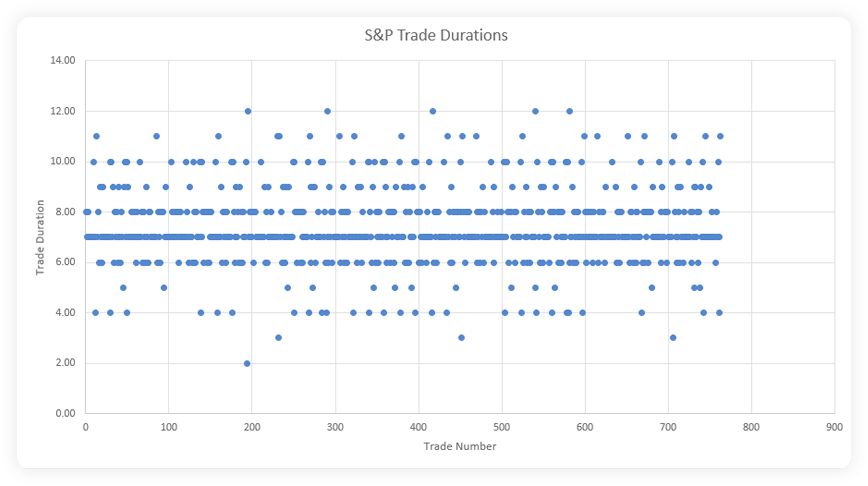
The chart shows the duration of every trade we have placed in the S&P for 15.5 years. As of the end of May, 2022, there were 762 of them. The X axis shows each trade and the Y axis shows trade duration. There has clearly been an average (the vast majority of our trades have lasted 6,7 or 8 days) but the oscillations outside of that range have been sporadic and chaotic. They’re not uniform as we showed in the example of a dynamic (unchaotic) system above.
… but they do behave just like one.
We showed how a dynamic system without chaos would oscillate wave duration beginning with a short wave followed by a long wave and then slowly finding a mid point. What’s interesting about the S&P is that it does the exact same thing by resetting with a short duration trade (2, 3 or 4 days) and is immediately followed by a long one (12, 11 or 10 days)… before working its way back into a range. Once disrupted, it starts over again.
For example, every time we have seen a 2 day pattern, this pattern has always been followed by a 12 day pattern. 3 day patterns have been followed by 11 day patterns. 4 days… followed by 10, etc. The shorter the duration of a pattern, the longer the following one has been (dynamic).
This cannot be said in reverse. 12 day patterns are followed by 6 days. 11 days are followed by 6,24 days. 10 days are followed by 6,38 days, etc. Short, then long, then finding a middle.
The markets are complex dynamic systems. Market oscillations tick back and forth just like water in a bath tub or like a clock pendulum. But the duration of each pattern can be influenced by news, reports, noise, volume and other nonsense (chaos). Chaos actually doesn’t screw up the pattern so much as it redefines it.
Chaos in the markets appears to initiate a fractal reset by returning to a dynamic system and beginning that new fractal with a short duration pattern. Effectively, the market just goes home. It starts over. It simply resets. It follows the exact same structure of a dynamic system… because it is a dynamic system.
Want to learn more about Fractals and math and physics in the financial markets?
Learn more about fractalerts and how we get rid of the influence of emotions on trading? Fill in the form on our homepage and a member of our team would be happy to give you a call or engage via email. Follow our trades. Leave the math to us.
To simply learn more about our process, check out our “The Science” page.


