
An infinite number of mathematicians walk into a bar. The first orders a beer while the second one says “I’ll have half of what he ordered.” The third repeats that phrase (referencing the second mathematician) and so goes the fourth and fifth and so on. After five or six of these orders, the bartender sets two beers on the counter and says “you guys know your limits.” Infinite series – The sum of infinitely many numbers, variables or functions that follow a certain rule. They’re “helpful for finding approximate solutions to difficult problems and for illustrating subtle points of mathematical rigor.” And… that’s about it.
Except… they are also excellent for visualizing mathematical fractals in data. Last week we discussed dynamic systems and how they follow very predictable patterns (with decay). They always begin with a short wave followed by a long one followed by a longer short wave and a shorter long wave, infinitely. This week we’re going to show examples of what they actually look like and show how an infinite series of data coalesce to form very predictable patterns.
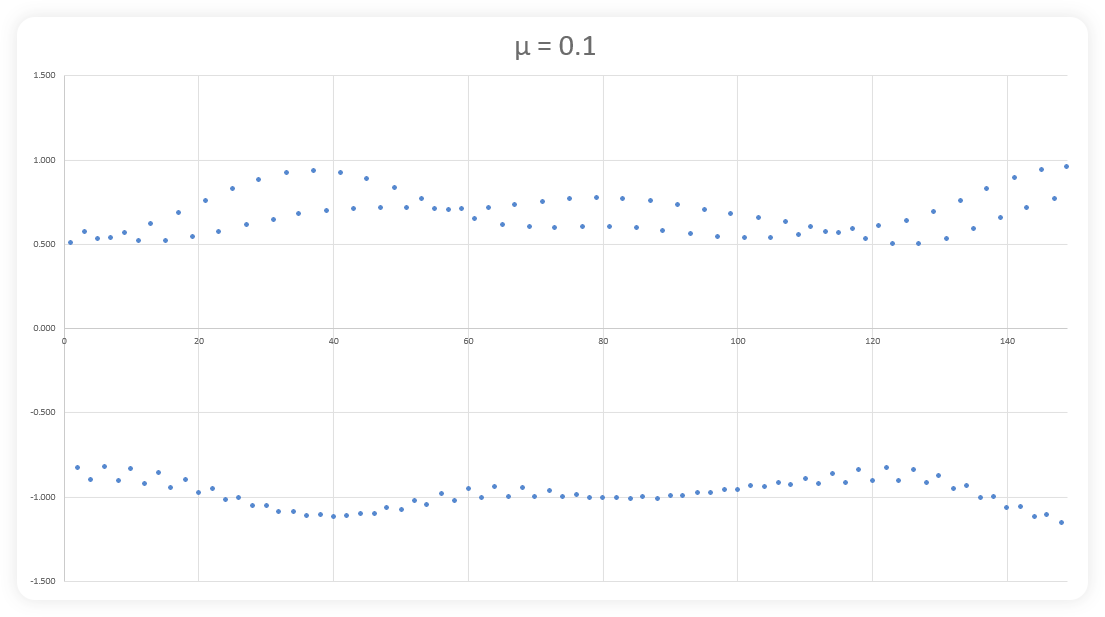
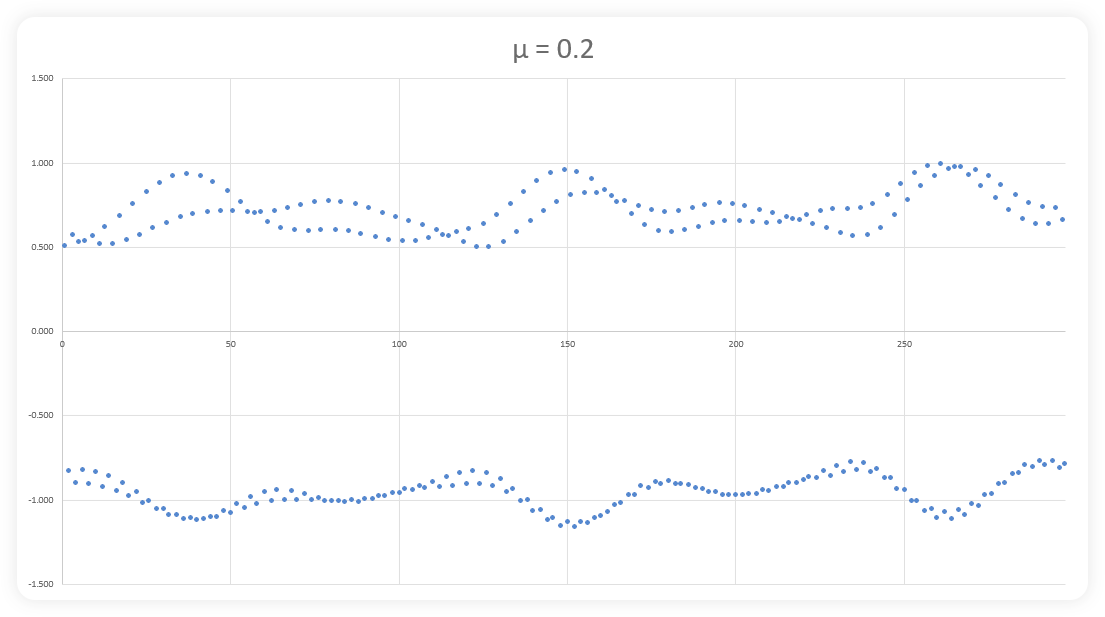
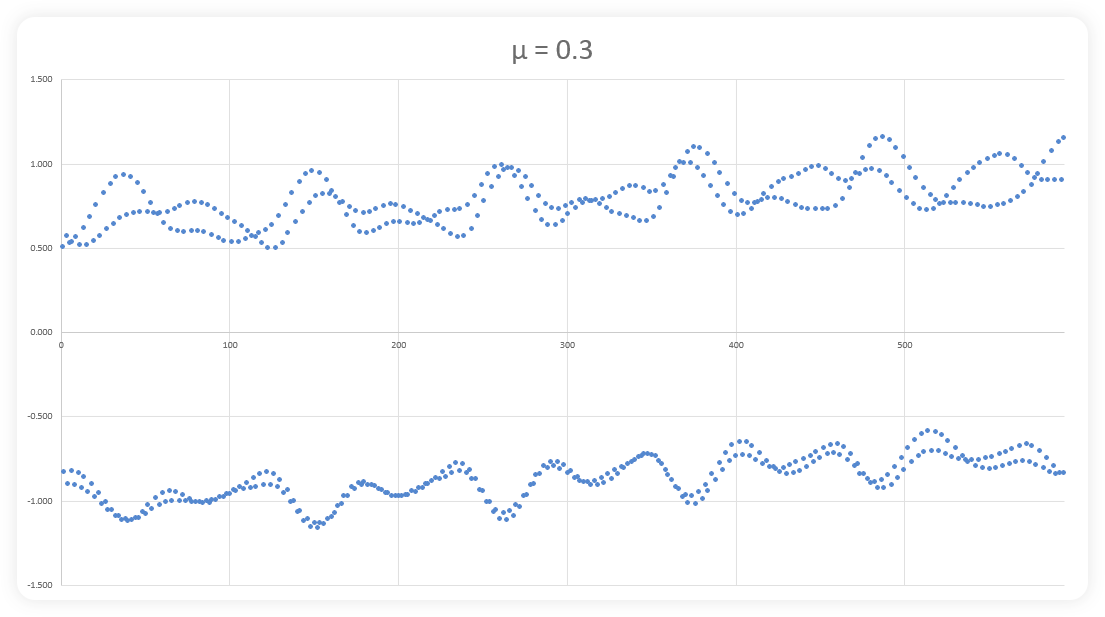
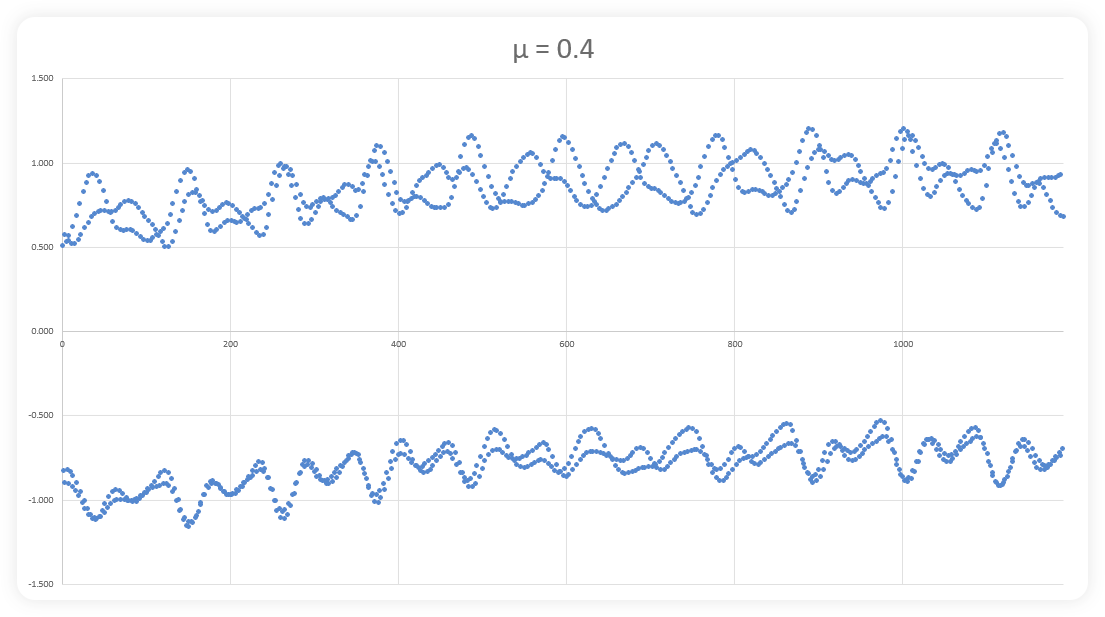
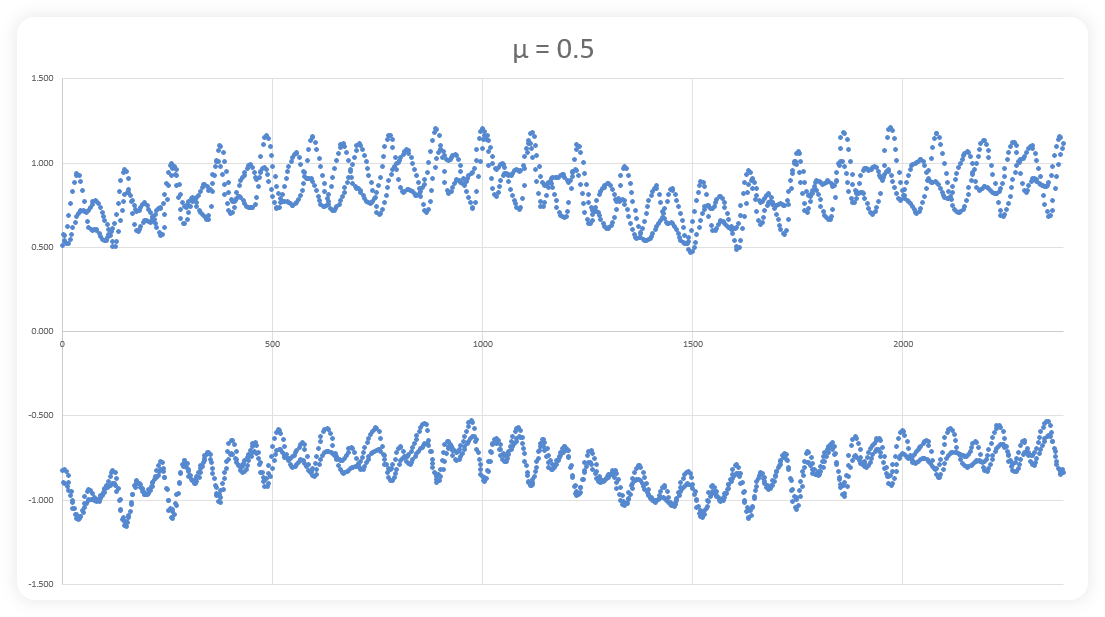
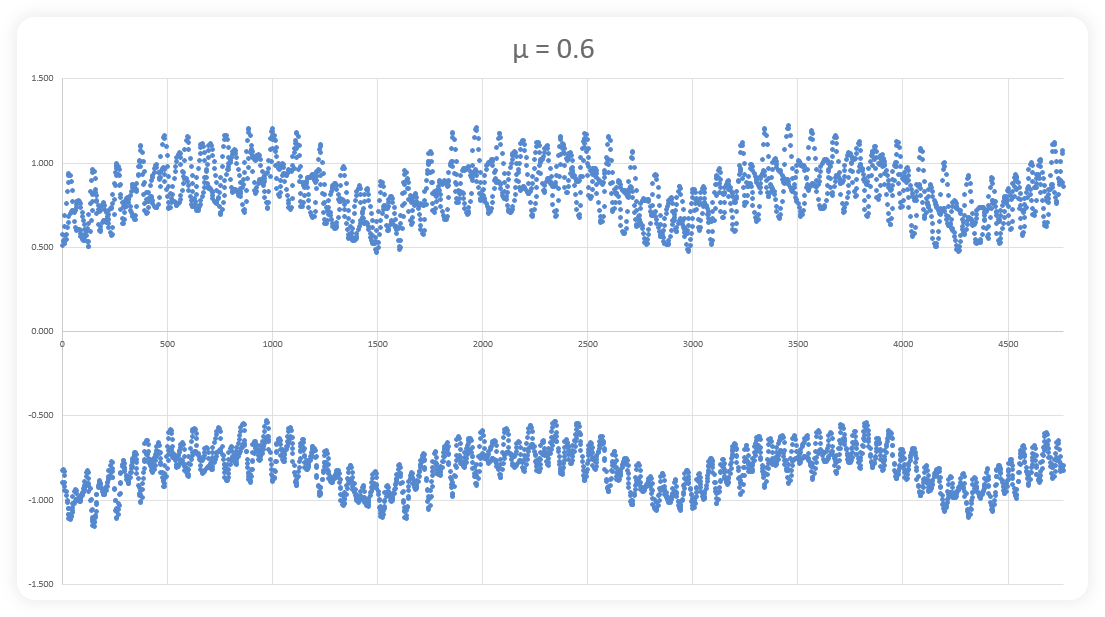
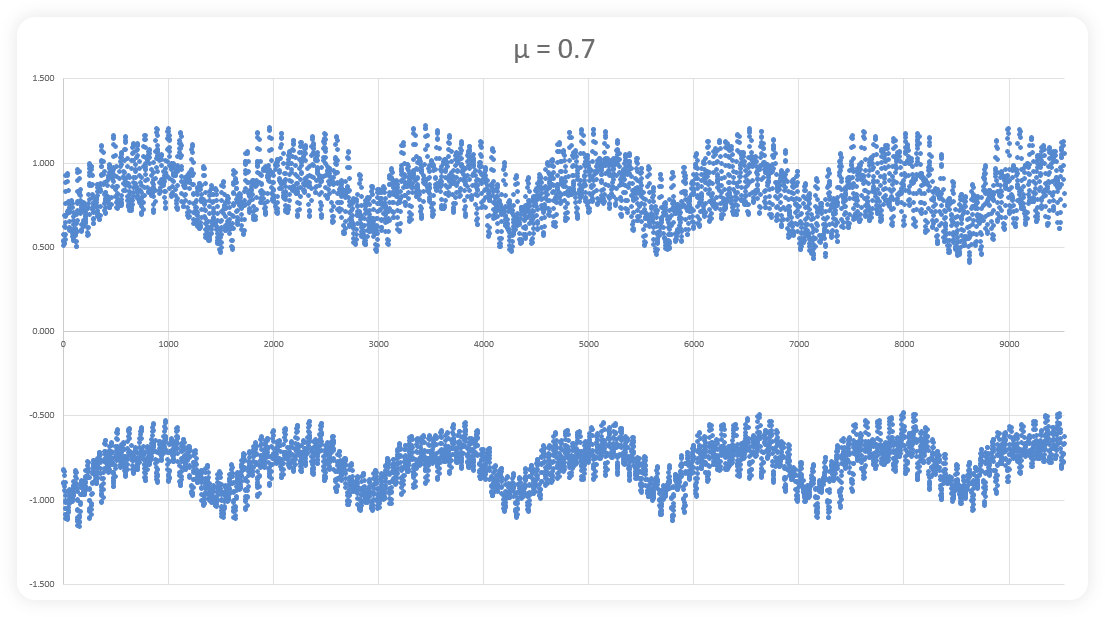
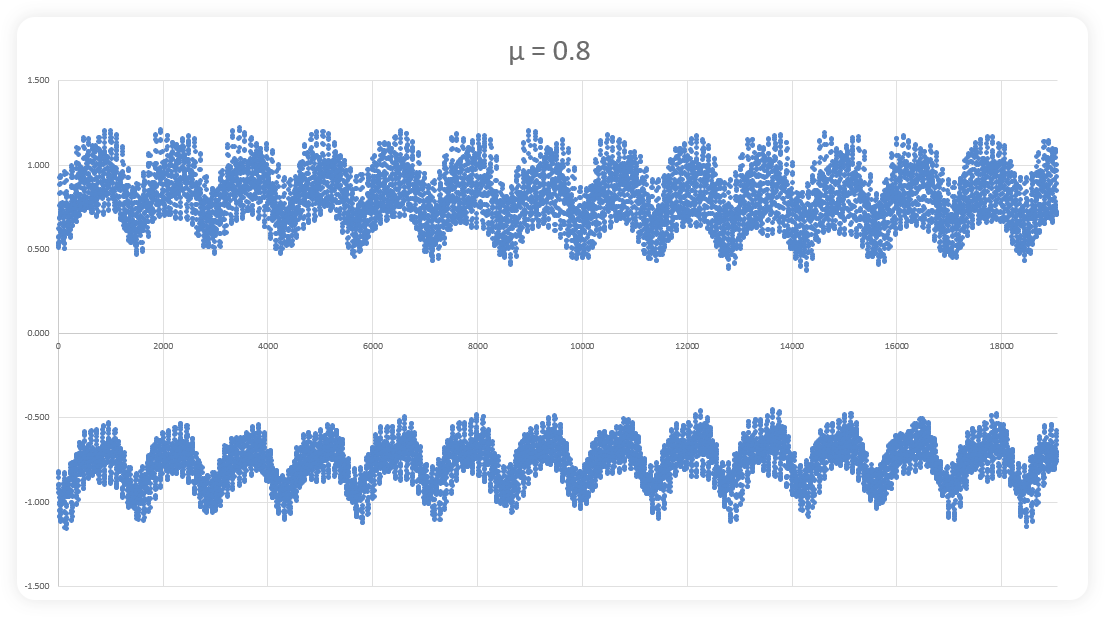
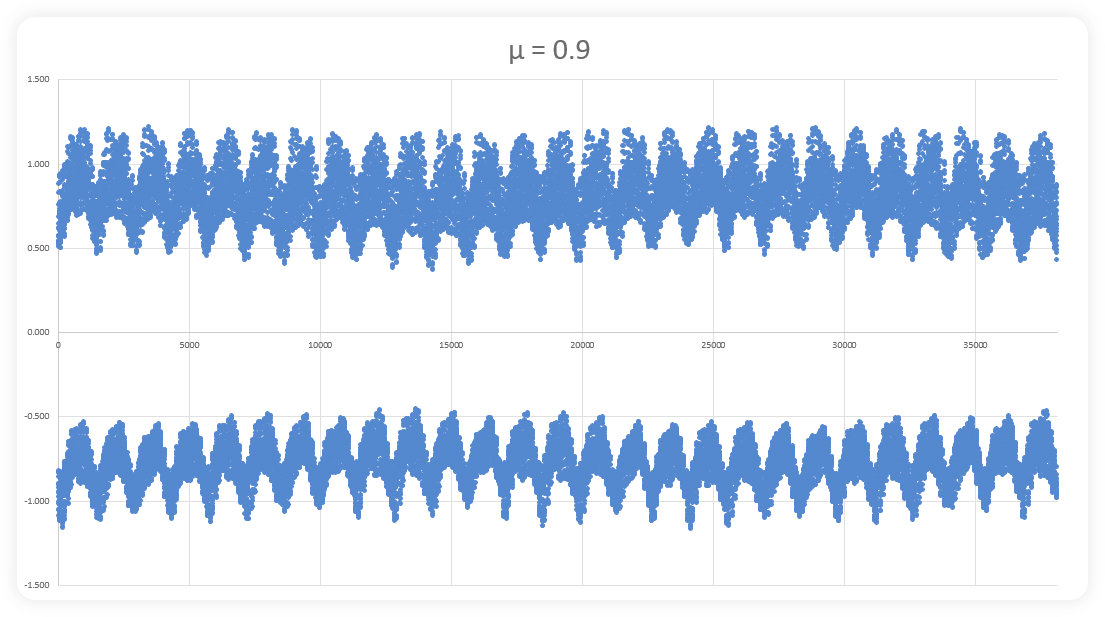
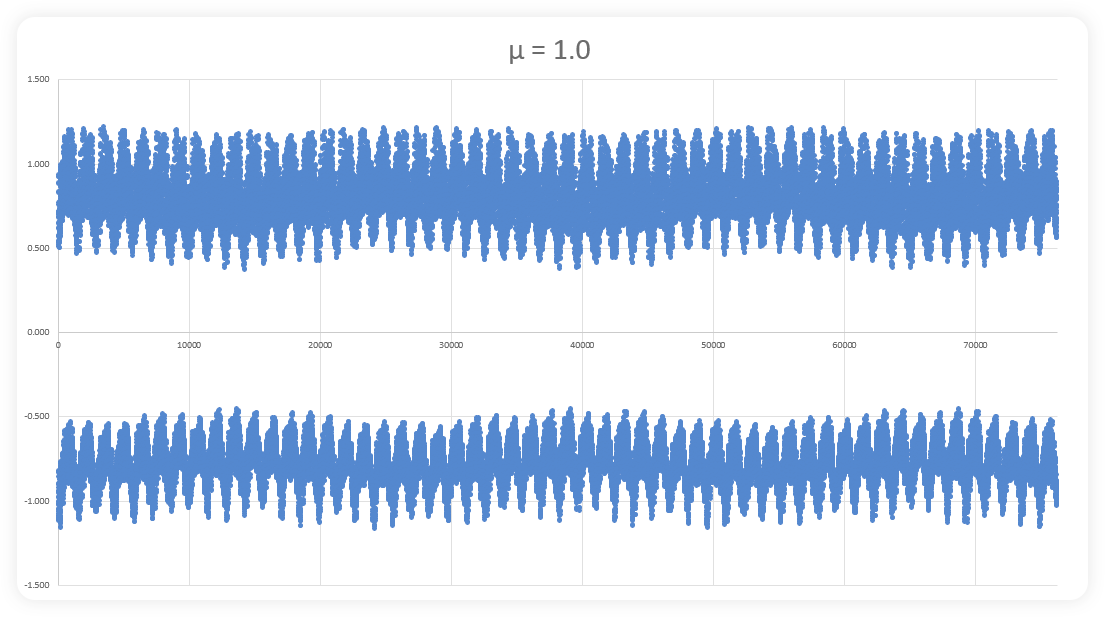
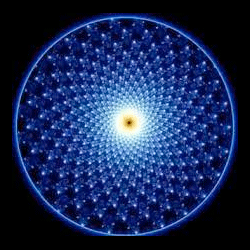
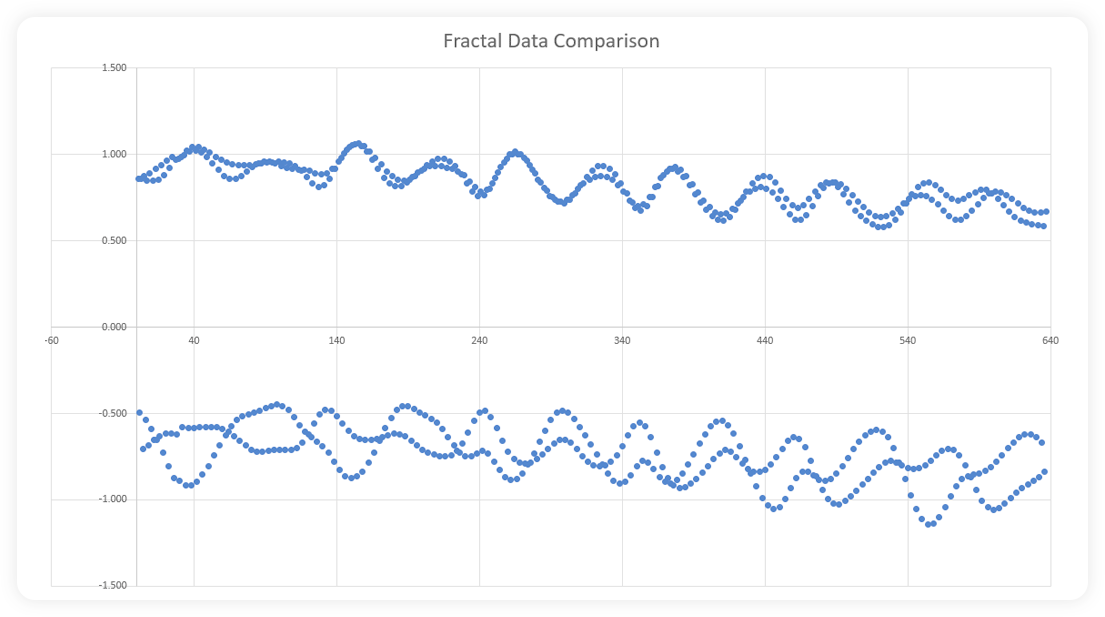
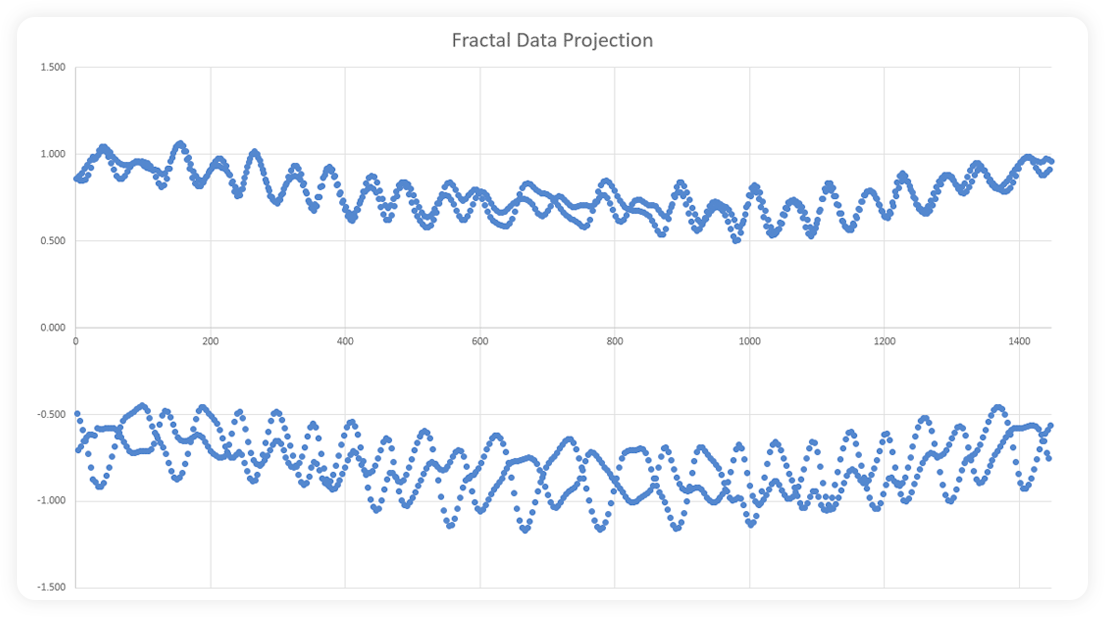
The images above show (progressively), how a mathematical fractal is built with more and more data. The first image shows a series of dots that seem to have no relationship to one another. However, by image three, some variable pattern begins to emerge with peaks and troughs showing up with recurring frequency. Image six shows the beginnings of even larger waves with multiple smaller waves in series while images seven, eight, nine and ten show that continued repetition. Continue this process indefinitely and one would find the exact same image, over and over and over again. There are actually multiple fractals within these images. You will notice the top and bottom of each image is slightly different on small scales and increasingly similar with more data. Actually these images show a 2D representation of a 3D structure (Hopf fibrations)… so they’re not as visually appealing as the images of fractals you have often seen,
but they are representative of an infinite series of data that goes so far to reach it’s limits before reversing direction only to find new limits. We discussed this on our blog about boundaries.
How does this relate to the markets?
First, and most importantly, markets don’t move sideways with repeated oscillations as depicted in the images above. Ideally (specifically in the Indices), markets appreciate over time. Because of this, price needs to be eliminated from the consideration. When eliminated, this leaves Time as the only importable variable. For example:
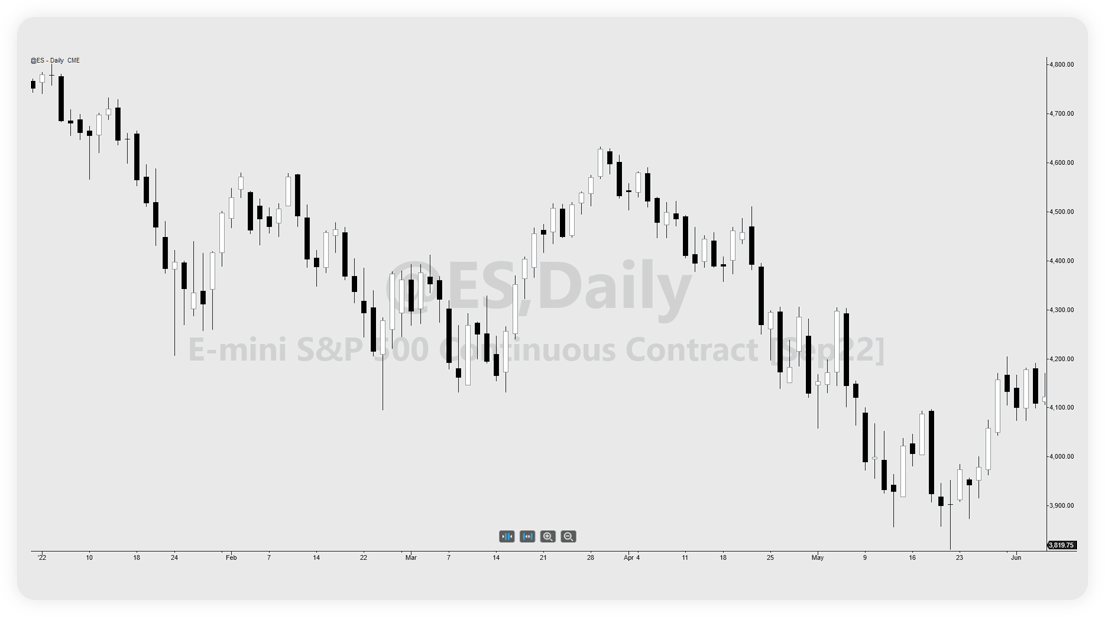
This chart shows the S&P over the last six months. Price drives the market lower but within that larger path lower are multiple peaks and troughs that make up the fractal. The peaks and troughs aren’t nearly as well defined as they are in the raw fractal, but they will be once price is factored out. Voila:
This image is the exact same data as shown in the S&P image above. Except we’ve run it through a Fourier transform (this topic will be explored at a later date). The result is a well defined fractal pattern with peaks and troughs that can be mapped out and traded. For example, project that pattern forward via wave / group velocity functions and we get to see what that fractal looks like for the next six months (looks kind of bullish actually).
A Fourier transform (FT) is a mathematical transform that decomposes functions depending on space or time into functions depending on spatial frequency or temporal frequency. – Wiki
As with the beer joke to open this article, every fractal operates within a boundary defined by time and identified via infinite series equations. Those boundaries can be seen two dimensionally in data that is only driven by time. The financial markets have boundaries as well, but they’re unobservable due to price appreciation and depreciation. It’s only when that data is observed through a fractal that they appear. Infinite series is how that observation is made.


