Sharpe Ratio is the answer that finance professors nationwide unanimously give.
But truthfully, it’s a trick question. As you’ll see, the most illuminating thing about statistics like this one are what they don’t tell you.
The Sharpe ratio is the asset management industry’s go-to statistic for backtested performance. If you’ve ever read this blog before, you already know how we feel about backtesting. It attempts to sum up risk-adjusted returns: how much risk did an investor have to take on in order to earn a given return? It’s far from perfect, yet it’s often a driving reason that money managers get hired or fired.
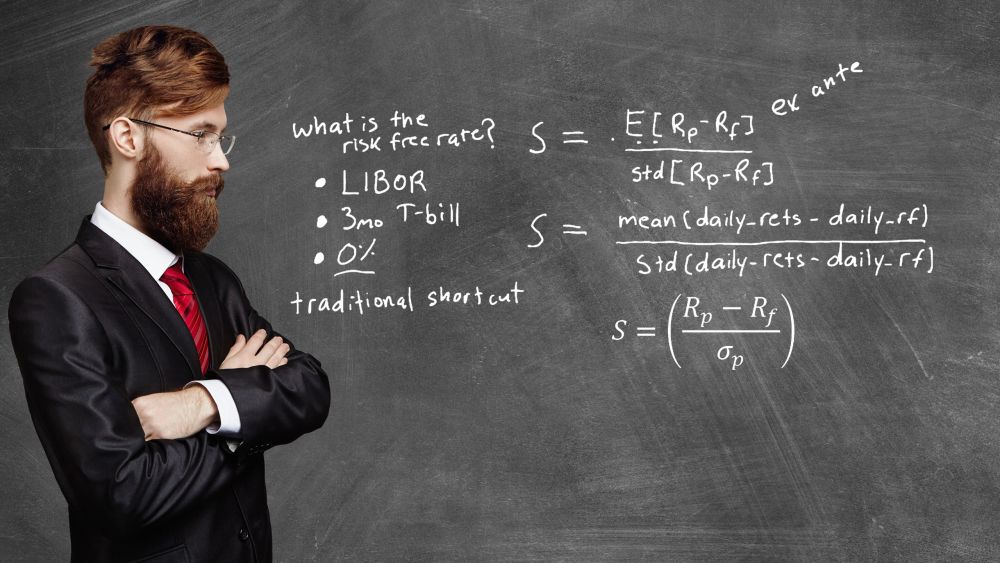
Sharpe Ratio = (Rate of Return - Risk-Free Rate) / (Standard Deviation of Return)
It’s deceptively simple: the bigger the resulting number, the better the performance, adjusted for risk. Sharpe ratio rankings are available for almost any mutual fund, hedge fund, trading strategy or asset class. But most people don’t actually know what they are, or what they can tell you.
Comparing Two Sharpe Ratios
Here’s how some investors use Sharpe ratios to judge funds or strategies. Let’s say you’re comparing the results of two traders. Both report a 20% return for the year.
- One trader was constantly on the lookout for new trades, parlaying his wins into his next move and mitigating losses. While he was up and down erratically throughout the year, he ended up gradually building an admirable 20% return.
- The other trader made one trade in January. It looked good, then it looked bad, then it recovered. It was all over the place. But it was ultimately just one position, wracked with volatility. At the end of the year, it was up a respectable 20%.
Two identical results, when peeled back and given a second look, couldn’t be more different. Anyone whose goal was to invest in a person or strategy instead of just a number would recognize the value that the first investor brought to the table: they’re simply more replicable, less dependent on outside variables. Returns tell you a little. The Sharpe ratio tells you a bit more. Some returns simply aren’t worth the risk.
Breaking Down the Sharpe Ratio
The Sharpe ratio starts with a rate of return in the numerator. The return is generally presented as an annual return, but may be longer or shorter term.
Return = 20% = .20
Then, subtract the risk-free rate of return, which is generally going to be low-risk T-bills: typically 10-year US government bonds with very little risk. At the time of this writing, they’re going for 1.54%. This is basically benchmarking the return against the lowest common denominator for the market. If you can get a certain amount of return “risk-free”, then only the amount beyond that should reflect on a fund, trader or asset class.
Return – Risk-Free Rate
.20 – .0154 = .1846 = 18.46%
This is our numerator, 18.46%. It stands to reason that a high Sharpe ratio will have a large numerator. A good asset class, fund or trader should have a pretty sizable return beyond a 10-year T-bill. Now, we divide this return by its standard deviation, effectively penalizing it (through a larger denominator) for being volatile.
This is where the Sharpe ratio gets tricky: volatility isn’t the same thing as risk, though successful funds tout their high ratios as if they had mitigated all risk. It’s tough enough to define volatility and virtually impossible to define it in a broad sense that would apply to a wide variety of assets and strategies. So, the standard deviation (which is a statistical tool, not necessarily a predictive one) of past rates of return serves as an oh-so-imperfect proxy for volatility. (Can you see how we’re starting to get a few steps away from rock-solid evidence here?)
Let’s say the standard deviation is 10%. This means that, statistically speaking, about 2/3rds (68%) of the time, the rate of return is between 0% and 20%, and 95% of the time, the rate of return is between -10% and 30%. Pretty volatile, but not off the charts. Plugging it into our Sharpe ratio formula, we get:
Return – Risk-Free Rate / Standard Deviation
.1846 / .1 = 1.846
This is a very strong Sharpe ratio. The kind that firms bragged about in the late 90s and mid-2000s – right up until market crashes wiped them out. While a 20% return would get you a raise and promotion at many trading desks, if it means surviving 10% volatility, year after year, you probably won’t have a very long career. And that’s not even addressing the fact that standard deviations of returns don’t measure volatility. It’s literally a completely different statistic, masking the many larger forces in the market that can wreck you.
So don’t ignore the larger forces. Use them to guide your decision making. Interested in using fractalerts to inform your strategy? Get started today by telling us about what you trade on our Get Started page.
-

The rhytm beneath the noise
-

You Don’t Need a Trading Style. You Need an Edge.
-

Consistency Isn’t the Goal—It’s the Outcome
-

What 2 Quadrillion Data Points Told Us
-

Math and Physics-Based Trading in Any Market Condition
-

Do not worry about anomalies
-

Consistency should not be the goal. Consistency should be the result.
-

Stop canceling fridays
-

The Elliott Wave Forecast is Subjective, Bias Driven And Backwards looking
-

Finding patterns in market data

