Mandelbrot trading? We talk a lot about fractals here at fractalerts. In fact, the reason we mention them so often is because they form the basis of our trading strategy, and not just for fractalerts. Our other brands of fractalgo and fractalternative are also based on fractal geometry and our application of that data to the financial markets.
But, unlike fractals, we don’t want to repeat ourselves. So if you would like to know what a fractal is, where you can find them in nature, and how they can be used to your advantage then follow the links.
Today, however, we are going to be talking about one chap in particular – Benoit B. Mandelbrot. He was a Polish-born, French and American mathematician, who was one of the first people to display fractal geometric images created using computers. Although that is a relatively easy thing to do now, dependent on software, back in 1979 when the working world was pretty consistently analogue, Mandelbrot was seen as a revolutionary.
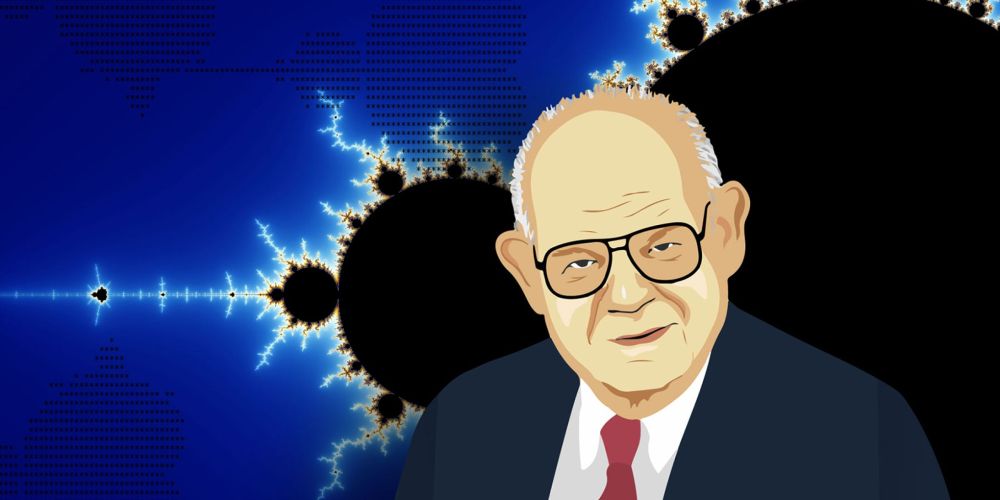
These early works eventually culminated in the discovery of the Mandelbrot Set which can then be further extruded into the image you seen in the header of this blog. That led to the joke that only mathematicians with a knowledge of fractals will get… What does the B in Benoit B. Mandelbrot stand for? Benoit B. Mandelbrot.
The image you see above is infinitely repeating, and when you zoom you will continue to see those repeating patterns until you get bored or run out of processor capacity – whichever happens first.
In fact, Orson Wang, an automotive engineer from Detroit bought three computers and set about becoming the person to have zoomed further into a Mandelbrot set than anyone else before or since.
Wang spent three months choosing the right position to start, before setting his computers to work for a further six months to produce a zoom that magnifies 10275 times. Alex Bellos, in his amazing work Alex Through The Looking Glass; How Life Reflects Numbers and Number Reflect Life, explains that this level of zoom is akin to zooming from ‘the size of the observable universe into a proton six times [over]’.
The best thing about modern technological advances is that you don’t need to have a super-processor in your computer in order to view Orson Wang’s work, you just need to head over to Youtube. Wang has uploading animations of his discoveries so you can fully enjoy the process.
The Mandelbrot Set ushered in a new era of marrying computer processing power with advance mathematics, and arguably it not only created a new type of math but opened up a broader area of mathematical sciences.
Mandelbrot trading
At fractalerts we continue to use advance math and science, with a basis in fractal geometry, in order to plan our mandelbrot trading strategy. That’s not to say that we do the same thing over and over infinitely. Our programs are continually hunting for fractals in market data, and as soon as we find one we change our trading strategy accordingly.
But its not just the fractals that make our trading strategies stand out from the crowd; it is the knowledge to apply them that really makes the difference.
We’ve taken almost a decade to hone our calculations, but these mean nothing if you don’t know what to do with the data you produce. In fact, if you are faced with Mandelbrot’s equation –
to be precise – without any context you aren’t going to get to see the amazing images that Orson Wang was able to extrude from the data. In much the same way, you can have the fractalerts calculations but without the knowledge that has been amassed by a committed team over the course of nearly ten years, you aren’t going to be seeing anything beautiful in your returns.
-

The rhytm beneath the noise
-

You Don’t Need a Trading Style. You Need an Edge.
-

Consistency Isn’t the Goal—It’s the Outcome
-

What 2 Quadrillion Data Points Told Us
-

Math and Physics-Based Trading in Any Market Condition
-

Do not worry about anomalies
-

Consistency should not be the goal. Consistency should be the result.
-

Stop canceling fridays
-

The Elliott Wave Forecast is Subjective, Bias Driven And Backwards looking
-

Finding patterns in market data

