

If you’re going to be a forex trader who makes profits not memes, it takes skill, emotional detachment and a thoughtful strategy. With some forex traders making dozens of trades a day, you have to be willing to test, learn and test again, always ready to admit that you were wrong just minutes before.
If you’re wading into the meme-infested waters of forex trading, make sure your strategy can withstand the onslaught of signals, bad advice and straight-up nonsense. These four kinds of fx tools will help make it all make sense.
Indicators Forex? Trend Following Tools
These attempt to represent the major trend underlying the everyday fracas of the forex markets: what’s the long-term mood of the markets been?
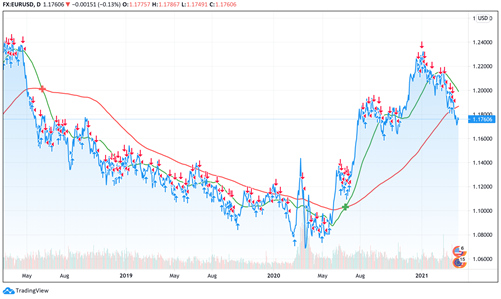
The last 3 years of EURUSD with a 50-day and 200-day moving averages overlaid.
Most fx trend following tools are a form of moving average crossover, that is, the signal you’re looking for is when a short-term moving average crosses over a long-term one. Common pairs are the 50-day/200-day and the 10-day/30-day.
Taking the 50/200 as an example, if the 50 has crossed over the 200 and is now higher, then the current trend is positive and it’s a good time to get in. In the chart above, this has only happened one time for the EURUSD currency pair in the last 3 years: July 2020.
Indicators Forex? Trend Confirmation Tools
Now that you’ve spotted a trend, how do you confirm that it’s worth pursuing? With another tool, naturally. Think of these tools as your way to double check if a trend is really occurring. Probably the most common is the MACD: Moving Average Convergence Divergence. This tool indicates trends in the difference between two moving averages, commonly the 50-day and 200-day, as shown above.

The same EURUSD chart from above, with a MACD histogram added below. Note how obvious bear and bull signals are in this chart. In May 2018, leading up to the bearish cross, there’s a large drop. In June 2020, before the bullish cross, there’s an upswing. If your trend spotting tool and trend confirming tool are telling you the same thing, then you might just want to listen. Just keep in mind that these tools sometimes operate on slightly different timelines. You’ll want to follow them closely to spot the moment to strike.
Overbought/Oversold Tools
These tell you when trends are getting out of hand – usually a good sign that they’ll reverse soon.
The three-day relative strength index (RSI) calculates the cumulative sum of up and down days over the last three trading days to produce a value that ranges from 0 to 100 (real quick.) A low RSI indicates a quick, recent and strong selling trend – everyone’s jumping out of this forex pair, so it might just be your moment.
These charts can cut away a lot of the daily noise and nonsense from your forex trading. Since the RSI is always between 0 and 100, you can get a better sense of when there’s been an extreme short term trend that’s likely to change, as opposed to playing a game of whack-a-mole and timing when a larger trend is likely to reverse.

The 1-year EURUSD chart with a 3-day RSI plotted below. The points below the purple band indicate buying opportunities and vice-versa.
Profit-Taking Tools
There are countless decisions you have to be able to make to trade intelligently. Perhaps the most important is when to take profits on a successful trade. Timing this correctly goes against everything about trading psychology, so it’s important to set up a reliable tool to offload some of the decision making. Otherwise, you’ll fall prey to the second-guessing and overtrading that can be any trader’s downfall. An easy one to get started with is a longer term RSI like the 15-day.

The 12-month EURUSD chart with a 15-day RSI below.
In the chart above, there are only 4 times the RSI breaks out of the purple band in an entire year: June, July-August, and twice in December. These are all followed by extended drawbacks, making them perfect times to take profits.
These tools will get you started – but they’re the same ones almost every forex trader is using. If you’re looking for an edge, focus on indicators that make trading forex even simpler, like fractalerts. Our customized alerts give you a signal 24–48 hours in advance of a trade we’re making in one of 39 markets, including forex pairs like EURUSD, GBPUSD, USDJPY, USDCAD and AUDUSD. To learn more, tell us a bit about what you trade on our Get Started page.


