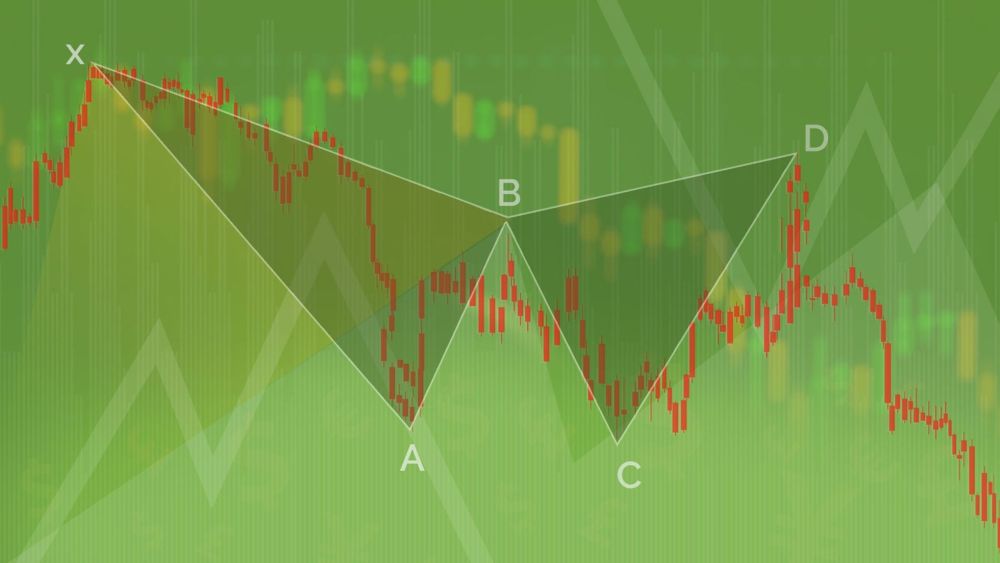
Learn about the Gartley Trading Pattern
Back in the mid-1930s, Harold McKinley Gartley ran a stock market advisory service, which had a significant following. His service was the first to apply statistical and scientific methods to help analyze the stock market’s behavior. According to him, Gartley helped solve the two largest problems for traders: what to buy and when. Soon after, traders realized that they could apply these patterns to other markets, which is why many things feature the Gartley pattern.
Gartley provides a nice setup to form the reversal points, giving a better indication of when or if the pair could reverse.
What is a Gartley Pattern?
So, what is a Gartley pattern? The Gartley ‘222’ pattern, named after the page number on which it is found in one of his books, focuses on the basic ABCD pattern. However, it is preceded by a large low or high. When the pattern usually forms with a correction on the overall trend, it looks like the letter “M” for bullish patterns and a letter “W” for bearish patterns.
These patterns are useful to help traders find the right entry point to jump into the trend.
A Gartley pattern happens when the price actions have been going well on a recent downtrend or uptrend but starts to show the signs of correction. It’s considered an indicator that can be used with a variety of methods. For example, with the Fibonacci retracement or Fibonacci extension level, the Gartley provides a nice setup to form the reversal points, giving a better indication of when or if the pair could reverse.
Of course, the pattern is challenging to spot, and it can get quite confusing if you pop up all the Fibonacci tools to boot. You should take things one step at a time to avoid any confusion.
Regardless, the pattern contains bearish or bullish ABCD patterns and is preceded by point X, which is beyond point D.
The Perfect Gartley Pattern
It’s challenging to find a perfect Gartley pattern, but it will have particular characteristics, including:
- The AB move should be within 61.8 percent of the XA move.
- The BC move should be .382 or .886 of the AB move.
- If you have a retracement of your BC move that is .382 of your AB move, then the CD move should be 1.272 of your BC move. Along with such, if your BC move is .886 of your AB move, then the CD move should extend 1.618 of your BC move.
- Your CD move should have a retracement of .786 for your XA move.
Mutants of the Gartley Pattern
Of course, as with many things in Forex trading, there are variations to each of the moves, indicators, and patterns. When the Gartley pattern became popular and started to grow, people came up with variations. These can include the Crab, Bat, and Butterfly, among others.
The Crab was discovered in 2000 by Scott Carney. He believed that the Crab was the best harmonic pattern because it had an extreme Potential Reversal Zone from the XA move. Carney also founded the Bat, which uses a retracement of .886 of the XA move for the Potential Reversal Zone while the Butterfly, created by Bryce Gilmore, uses a retracement of .786 of the AB move in respect to the XA move.
-

The rhytm beneath the noise
-

You Don’t Need a Trading Style. You Need an Edge.
-

Consistency Isn’t the Goal—It’s the Outcome
-

What 2 Quadrillion Data Points Told Us
-

Math and Physics-Based Trading in Any Market Condition
-

Do not worry about anomalies
-

Consistency should not be the goal. Consistency should be the result.
-

Stop canceling fridays
-

The Elliott Wave Forecast is Subjective, Bias Driven And Backwards looking
-

Finding patterns in market data

