
It’s chaos out there.
There’s the war in Ukraine. Forest fires around the globe. And Elon Musk didn't decide to buy Twitter after all… Chaos!
But remove those chaotic events for a moment and what are you left with? Today is still Friday (Saturday if you’re in AUS and NZD). The markets are still open and you’re probably still at work.
You’ve just identified a fractal via chaos theory. If you analyze this further, you will realize the decisions you make today will largely be driven by the underlying fractal nature of your life rather than the chaotic events jumping in and out as life goes on.
To analogize this to the markets, strip out the chaos of market reports, Fed meetings and nearly anything talked about on CNBC, and you’re left with smooth, identifiable fractals. Ones which can be easily identified and traded absent any emotion or chaos.
Fractals and Chaos Theory
Fractals and Chaos theory is a branch of mathematics, where chaos theory is focusing on the study of chaos—states of dynamical systems whose apparently random states of disorder and irregularities are often governed by deterministic laws that are highly sensitive to initial conditions.Markets may appear to just be a series of numbers or lines and bar charts on a graph. But they are complex, organic systems which are brought to life by the behavior and biases of traders. These biases lead to anomalies and erratic movements unrelated to the underlying patterns driving the markets themselves.
In other words, strip away the emotion of trading and we would be left with a very boring, slow moving quasi-periodic sine wave (a fractal) (much like your day today without the chaos). One where a slight majority would buy and sell at the same time as one another (because the peaks and troughs would be obvious). Add in the emotion and those underlying sine waves still exist but they look choppier and more erratic (fractals with chaos).
How often have you seen markets moving steadily in one direction only to be hit by a shock (a report, some news or some otherwise unpredictable event), only to see that market return to the underlying steady pattern almost immediately after the shock was absorbed? The 2016 US Election? The 2010 flash crash? The start of the Corona pandemic? Multiple Fed rate changes and hundreds of other less significant events that had very immediate short term impacts but no price change by the end of the day or week? 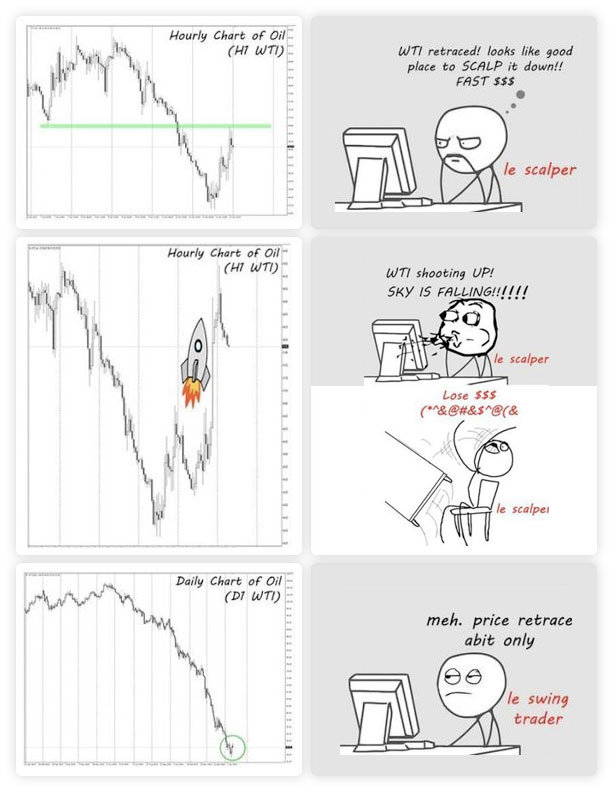
Chaos theory explains these events away as “apparently random states of disorder and irregularities.” But do they actually have any impact on the underlying fractal pattern?
Our research suggests they don’t, at least not when giving a fractal pattern enough time to absorb the shock. For example, if you get a flat tire while driving along the road (chaos), this deviates your normal life (fractal) for only a short period of time (until you get the tired fixed). After which all is back to normal as if the event never occurred in the first place.
The same can be said about the markets. Anomalies or shocks occur on a daily, if not on a minute by minute basis. Some of these shocks can be large (September 11th, for example). Others can be incredibly small, like what Elon Musk had for lunch (does he have time to eat lunch). But all of them are wholly unrelated to the underlying fractal pattern that drives the markets on a daily basis.
Now for some math. How are fractals identified?
“The mechanical act of cutting off an otherwise pure sine wave will introduce spurious frequencies differing from the natural one. The actual sharply terminated beam behaves like a Fourier integral of pure sine waves.” (from: Mathematical Physics by Menzel). 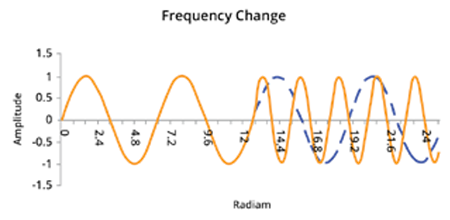
In financial data, observations of price, volume, momentum (delta and delta of delta), and elapsed time reveal fractals. Fourier transforms identify the fractal by recreating the pure monochromatic underlying pattern by stripping out the noise and emotion driving those data points. This stripped down version of the data looks like a market moving on a pure sine wave absent any emotion or shock (no flat tires). 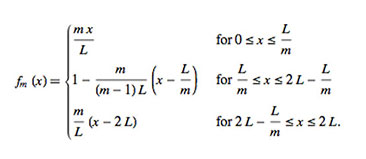
Once that fractal’s sine wave is identified, wave / group velocity functions are used to project the known pattern forward to determine the next turning point of the new higher or lower frequency sine wave. 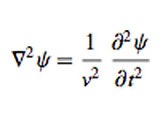 Math lesson finished. You can stop sweating.
In 2012, Nate Silver wrote a book called “The Signal And The Noise – Why So Many Predictions Fail”. The words “chaos theory” were not used at all in the book but effectively what he is describing as Noise is the Chaos. And The signal is the fractal.
“Distinguishing the signal from the noise requires both scientific knowledge and self-knowledge: the serenity to accept the things we cannot predict, the courage to predict the things we can, and the wisdom to know the difference.” – Nate Silver
Want to learn more about Fractals and Chaos Theory?
Learn more about fractalerts and how we get rid of the influence of emotions on trading? Fill in the form on our homepage and a member of our team would be happy to give you a call or engage via email. Follow our trades. Leave the math to us.
To simply learn more about our process, check out our “The Science” page.


