
Each week, we get emails from individuals looking for fractal indicators (there is no such thing). Others are curious about the math and physics we use and still others stumble across our site while looking for some genuine help generating profitable trades. A good portion of those who reach out mention the Elliott Wave Forecast.
- “I utilize the Elliott Wave theory with emphasis on the ongoing fractals that makes up the patterns in my trading.”
- “I do technical analysis and was following Elliott waves. Elliott waves are supposed to work on all time frames since they are fractals and that’s I understand what a fractal is.”
- “I have heard that Market Structure (elliott wave) is the best way to trade this market. “
- “Do you use Elliott Wave Theory as well, it ties well with fractals?”
These quotes are all good natured comments or questions and they all come from a good place. But they are all wrong. Elliott Wave Forecast isn’t based on a fractal. It has nothing to do with fractals. We have no idea why it ever got tied to fractals… but “If you tell a lie big enough and keep repeating it, people will eventually come to believe it.” (You all know who said that… we don’t need to give the monster any credit).
So, what is an Elliott Wave Forecast?
Ralph Nelson Elliott created the Elliott Wave Theory based on his belief that the stock market, like all human behavior, followed a pattern linked to the famous Fibonacci sequence.
Elliott’s suggestion was that market prices alternate between a five-part impulsive (or motive) phase, followed by a three-part corrective phase on all time scales of a trend. Within these two phases are several predictable (they are not) wave-like oscillations. Hence the name.
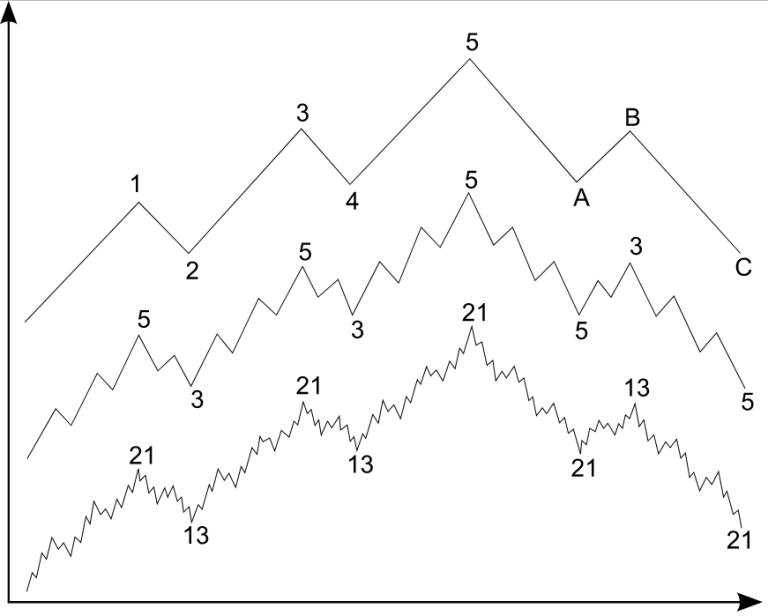
In the illustration below, you can see the same market data at three levels of granularity. Let’s focus on the top level. The numbers 1–5 represent the crests of the five waves of the impulsive phase, while A, B and C represent the three waves of the corrective phase. On the two charts below it, you can see more detailed five- and three-part phases that occur within the two macro phases.
And… Here lies the problem.
Looking at a historical chart, it’s very easy to draw these “waves” as an overlay. Now try to walk those sequences forward and the guessing begins.
It is impossible to know when you have reached wave 2 or A or 5 or 13… until after they have already occurred. This process of identification is reactive, not predictive. And even if a peak or trough looks like a particular number on this graph, time may suggest you were simply too early or late. This misidentification leads to a recalculation, new identification and new speculation as to where the market is in time… only to start the process again.
Not to mention, someone else looking at the exact same chart may have a different opinion as to where the market is in the cycle. It’s subjective. It’s bias driven. It’s backwards looking.
Elliott described his Wave Theory as occurring on “all time scales of a trend.” He suggested that the exact same push-and-pull patterns that happened every day on trading floors were also happening on longer time frames.
Ahhh… So this is why people often confuse Elliott Wave with fractals (it’s not a fractal).
Remember: this was 1938
Ralph Elliott took notice of these patterns in an era (the 1930’s) when the stock market was still largely unquantified. Millions of Americans and would-be traders were scared off by the recent crash of 1929 – basically the polar opposite of today’s retail-trader bonanza, when everyone and their mom (and their mom’s chatty friends on Facebook) are downloading Robinhood and jumping headfirst into speculating.
Back then, traders were literally yelling “Buy!” and “Sell!” at one another inside the trading pit, instantaneously pushing prices up and down. Elliott theorized that these minute changes had a predictable way of adding up over time, even though no single trade was driving the long term price up. The result, many have suggested, is a fractal pattern that looks the same no matter how much you zoom in. That is, no matter the time scale.
Except… it’s not a fractal (fractal: mathematically identified pattern in data… without the interpretation or biased observation). Elliott Wave Forecast is speculation and assumption. The observations made by traders are driven by their existing bias which may also be completely different from the next person observing the same information (25 technical traders disagreed on the direction of the same indicators because of their bias).
How are fractals different?
This is like comparing apples and … well… space monkeys. But we will give it a shot.
Fractals in data are 2 dimensional visualizations in a 3 dimensional space (a 3-sphere). They can be seen visually in nature or space. They can be constructed out of data (provided there is enough of it) and they can be projected forward after the fractal has been identified.
One must use electromagnetic theory (something we will get into next week), gauge theory, chaos theory and wave / group velocity functions (pure math and physics). This process is absolute. There is no guessing. No ambiguity. And no speculation. The math determines if and when a fractal has been identified.
Elliott Wave, on the other hand, requires you to stare at a chart (no one wants to do that) and speculate about where you are in space and time operating on the assumption this 5 up / 3 down pattern has any basis in reality (it doesn’t). Common misconceptions about Elliott Wave include:
- It’s a fractal (not it’s not).
- It’s a leading indicator (again… no).
- It’s pattern recognition technology (shakes head).
In short, Elliot wave is awesome at telling you what has happened… and rather useless at telling you what will happen.


